


Profitability-led PPC is a performance marketing strategy that maximises net profit from paid advertising by aligning bids and budgets with true business outcomes rather than revenue or click volume. The industry standard term for this approach is profit-driven pay-per-click, and it sits in direct contrast to traditional PPC models that chase ROAS without accounting for margins, fees, or returns. The core metric is POAS (Profit on Ad Spend), calculated as (Revenue × Gross Margin Percentage) ÷ Ad Spend, with a target of 200% or above. Understanding profitability in PPC means every pound spent on ads must generate measurable net profit, not just revenue. This guide explains how the model works, what tools it requires, and how eCommerce businesses can apply it in 2026.
How does profitability-led PPC differ from traditional PPC?
Traditional PPC campaigns measure success through clicks, impressions, and ROAS. These metrics are easy to report but dangerously incomplete. A campaign returning 500% ROAS on a product with a 15% gross margin is almost certainly losing money once you account for fulfilment, platform fees, and returns.
Profitability-focused PPC replaces platform-reported ROAS with reconciled, margin-true metrics such as contribution margin and CAC payback speed. Contribution margin strips out variable costs from revenue, leaving the actual profit a sale generates. CAC payback speed measures how quickly customer acquisition costs are recovered through repeat purchases.


The table below shows the practical difference between the two approaches:
| Metric | Traditional PPC | Profitability-led PPC |
|---|---|---|
| Primary KPI | ROAS | POAS / Contribution margin |
| Bidding goal | Maximise revenue | Maximise net profit |
| Cost inputs | Ad spend only | Ad spend + fees + returns + fulfilment |
| Optimisation trigger | Revenue drop | Margin threshold breach |
| Evaluation window | 7–14 days | 60 days minimum |
Bidding strategies such as Target ROAS and Maximise Conversion Value are not discarded in a profit-driven model. They are adapted. You feed net margin values as conversion values rather than gross revenue figures, so the algorithm bids towards profit rather than turnover.
Pro Tip: Never use your selling price as the conversion value in Google Ads. Use your net margin per order instead. This single change reorients the entire bidding algorithm towards profit.
No single profitability button exists inside ad platforms. Profitability-led PPC is a logical layer you build above the platform, requiring explicit definitions of what each conversion is actually worth to your business.
What tools and data integrations does profit-driven PPC require?
Implementing a PPC profitability strategy without the right data infrastructure is like navigating without a map. You need three core capabilities: margin calculation, conversion value passing, and real-time monitoring.
-
Dynamic margin calculation. Build a margin feed that calculates net profit per SKU after deducting cost of goods, shipping, platform fees, and average return rates. This feed updates automatically when costs change. Static margin figures become inaccurate within weeks in a live eCommerce environment.
-
Custom conversion tracking. Pass net profit values into Google Ads and Microsoft Advertising via enhanced conversions or server-side tagging. Standard conversion tracking passes revenue. You need to pass margin. This requires a developer or a feed management tool that supports custom conversion value rules.
-
First-party data integration. Enhanced conversions use hashed customer data (email, phone) to improve match rates between ad clicks and purchases. This is particularly important as third-party cookie deprecation reduces the reliability of standard pixel tracking.
-
Business intelligence monitoring. Connect your ad accounts to a BI tool such as Looker Studio or a dedicated profit dashboard. This gives you a real-time view of contribution margin by campaign, product group, and channel, rather than relying on the platform’s native reporting.
Pro Tip: Set up a separate column in your reporting dashboard for “profit per conversion” alongside cost per conversion. When these two figures move in opposite directions, you have a margin problem that ROAS will never surface.
The table below outlines the key data inputs required for accurate POAS calculation:
| Data input | Source | Update frequency |
|---|---|---|
| Cost of goods | ERP / inventory system | Weekly minimum |
| Platform fees | Marketplace API | Real-time |
| Return rate by SKU | Order management system | Daily |
| Shipping cost | Carrier API | Weekly minimum |
| Ad spend | Google Ads / Meta API | Real-time |
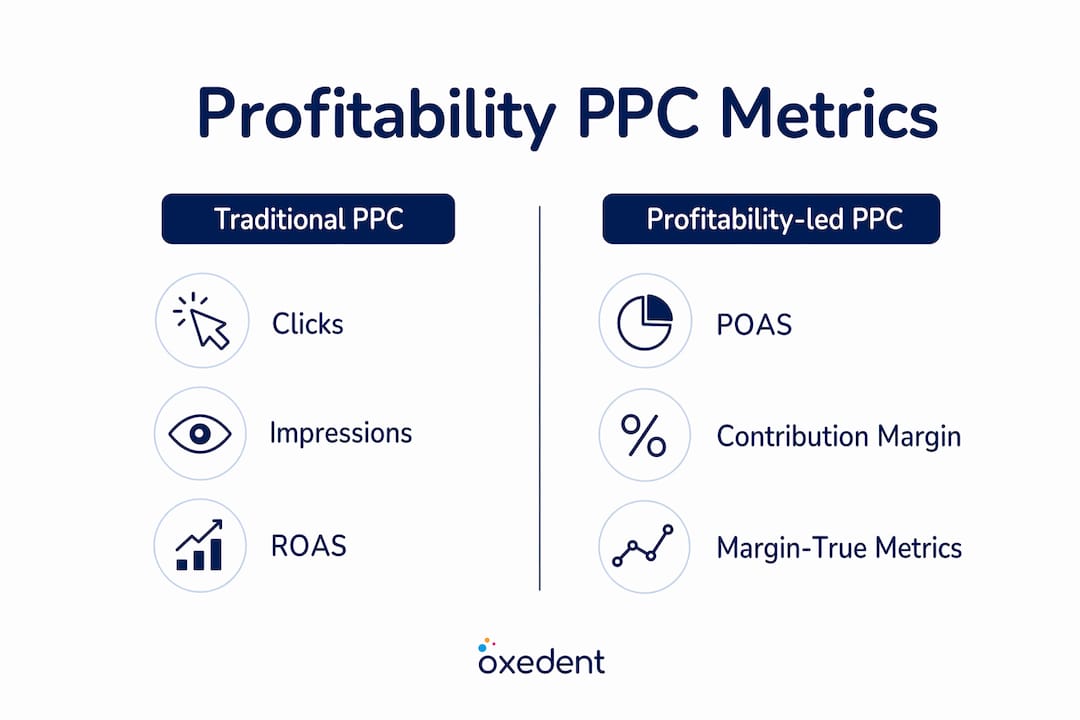

Aligning PPC bids with SKU-level profits, including fees and returns, enables you to prioritise high-margin conversions and reduce wasted spend on products that look profitable on the surface but are not.
What are the best practices for managing PPC campaign profitability?
The most common mistake in profit-led PPC management is acting too quickly. Campaigns need time to generate statistically meaningful data, and conversion attribution lags behind actual purchase behaviour.
A 60-day evaluation window is the minimum before making major optimisation decisions. This accounts for the algorithm’s learning phase, delayed conversion attribution, and seasonal noise. Cutting a campaign after two weeks because POAS looks low is almost always premature.
The following practices define disciplined PPC campaign profitability management:
- Set hard margin thresholds before launch. Define the minimum acceptable POAS for each product category. If a campaign falls below that threshold consistently after 60 days, pause it. Not before.
- Separate high-margin and low-margin products into distinct campaigns. Mixing them forces the algorithm to average across margins, which means it will overspend on low-margin products.
- Review contribution margin weekly, not daily. Daily fluctuations are normal. Weekly trends reveal genuine performance shifts.
- Ignore impression share as a primary metric. Impression share measures visibility, not profit. A campaign with 40% impression share and strong POAS outperforms one with 90% impression share and negative contribution margin.
- Account for customer lifetime value. A first-time buyer acquired at a thin margin may be worth the spend if repeat purchase data shows strong LTV. Factor this into your threshold calculations.
Pro Tip: Build a simple spreadsheet that maps each campaign to its average order margin, average return rate, and 60-day POAS. Review it monthly. This single document will tell you more than any platform dashboard.
Short-term fluctuations are normal and expected. The learning phase of profitability-led campaigns often shows misleading early performance. Patience and a minimum 60-day evaluation window are required to capture true campaign profitability.
How can eCommerce businesses apply profitability-focused PPC to boost ROI?
The practical application of profit-driven pay-per-click in eCommerce starts at the product level, not the campaign level. You cannot manage profitability at scale without understanding which SKUs actually make money after all costs are deducted.
-
Map SKU-level profitability first. Before touching your campaigns, build a product profitability matrix. Rank every SKU by contribution margin. This becomes your bidding priority list.
-
Restructure campaigns around margin tiers. Group high-margin products together and assign them higher target POAS thresholds. Low-margin products get tighter bid caps or are excluded from paid campaigns entirely.
-
Feed margin values as conversion values. Replace revenue-based conversion values with net margin figures in your Google Shopping and Performance Max campaigns. This directly influences how the algorithm allocates budget across your product catalogue.
-
Monitor incremental profit gains. Track the change in total contribution margin week over week, not just ROAS. A 10% increase in ROAS means nothing if contribution margin is flat or falling.
The table below illustrates how margin-tier campaign structuring affects bidding priorities:
| Margin tier | Gross margin | Bidding approach | POAS target |
|---|---|---|---|
| Tier 1 (high margin) | 50%+ | Aggressive, high bids | 200%+ |
| Tier 2 (mid margin) | 25–49% | Moderate, controlled | 150–200% |
| Tier 3 (low margin) | Under 25% | Conservative or excluded | Review only |
Advanced margin tracking can boost conversion value by up to 30%. That figure reflects the efficiency gain from directing budget towards genuinely profitable conversions rather than high-revenue, low-margin ones. Businesses implementing value-based bidding strategies aligned with actual business outcomes see approximately £2 profit for every £1 spent. You can see how this plays out in practice through real eCommerce PPC case studies that document the shift from revenue-focused to profit-focused campaign management.
For Google Shopping and Performance Max specifically, scaling profitably in 2024 and beyond requires feeding accurate margin data into your product feed, not just optimising titles and images.
Key takeaways
Profitability-led PPC succeeds when you replace revenue metrics with margin-true data, set hard financial thresholds, and allow a minimum 60-day evaluation window before drawing conclusions.
| Point | Details |
|---|---|
| POAS over ROAS | Measure profit per pound of ad spend, not revenue, to see true campaign performance. |
| 60-day evaluation window | Allow campaigns to exit the learning phase before making major optimisation decisions. |
| SKU-level margin mapping | Rank products by contribution margin before structuring campaigns or setting bids. |
| Feed net margin as conversion value | Pass actual profit figures into Google Ads to align algorithm bidding with business outcomes. |
| Patience over reaction | Short-term POAS dips are normal; weekly trend reviews reveal genuine performance shifts. |
The shift I keep seeing brands get wrong
The most consistent mistake I see eCommerce brands make is treating profitability-led PPC as a settings change rather than a measurement overhaul. They switch to Maximise Conversion Value, call it profit-focused, and wonder why margins do not improve. The platform cannot optimise for profit if you are still feeding it revenue as the conversion value.
The concept of profit velocity changed how I think about PPC measurement entirely. It combines incremental profit margin with customer acquisition speed, which means a campaign that acquires fewer customers at higher margins can outperform a high-volume campaign on every metric that actually matters. Most brands never measure this because their reporting stops at ROAS.
Data reconciliation is the unglamorous part nobody talks about. Connecting your order management system, your carrier API, and your ad platform data into a single profit view takes real work. But without it, you are making bidding decisions on incomplete information. The brands that invest in this infrastructure consistently outperform those that do not.
My advice is to treat your margin thresholds as non-negotiable rules, not guidelines. If a campaign cannot hit your minimum POAS after 60 days, pause it. Discipline in financial thresholds is what separates profitable scaling from expensive growth.
— Biplab
Oxedent’s approach to eCommerce PPC profitability
Profit-focused PPC management is the entire operational focus at Oxedent, not one service among many.

Oxedent works exclusively with established eCommerce businesses, managing Google Ads, Google Shopping, and Performance Max campaigns with margin tracking and profit thresholds built into every campaign structure. If your current agency reports on ROAS without touching contribution margin or SKU-level profitability, you are leaving real money on the table. Oxedent’s eCommerce PPC management service is built specifically for brands ready to move beyond vanity metrics and scale on profit. You can also build a stronger financial foundation by pairing PPC management with a scalable eCommerce marketing budget plan.
FAQ
What is profitability-led PPC in simple terms?
Profitability-led PPC is a paid advertising approach that optimises campaigns for net profit rather than revenue or clicks. It uses metrics like POAS and contribution margin to guide bidding and budget decisions.
How is POAS different from ROAS?
ROAS measures revenue generated per pound of ad spend. POAS measures profit generated per pound of ad spend, making it a more accurate indicator of true campaign performance.
Why does profitability-led PPC need a 60-day evaluation window?
Campaigns require 60 days to exit the algorithm’s learning phase and for conversion attribution to fully resolve. Shorter windows produce misleading performance data.
Can small eCommerce businesses use profit-driven PPC?
Profit-driven PPC requires accurate margin data and custom conversion tracking, which demands some technical setup. Businesses with meaningful ad budgets and clear product cost data are best placed to implement it effectively.
What is the target POAS for a profitable campaign?
A target POAS of 200% or above is the standard benchmark, meaning £2 of profit generated for every £1 spent on advertising.