



Data-driven attribution distributes fractional conversion credit across every touchpoint in the customer journey, using your own account data rather than a fixed rule like “last click wins.” Switch eligible conversion actions to it, and you’ll see undervalued channels, particularly upper-funnel display and video, surface in your reports for the first time. The immediate action: check your DDA eligibility status in Google Ads or GA4 today, then use the model comparison report to see what changes.
TL;DR:
- Data-driven attribution requires at least 200 conversions and 2,000 interactions per month for reliable performance, with higher thresholds for some actions.
- Switching to DDA should be tested gradually, starting with lower-risk conversions and reviewing model comparison reports before broader implementation.
- Model accuracy depends heavily on consistent tracking, comprehensive data, and addressing cross-device gaps, as missing data can distort credit allocation.
- DDA tends to reallocate credit toward upper-funnel channels like display and video, improving bid accuracy and marketing spend efficiency for multi-channel, long-sales-cycle accounts.
- Regular re-evaluation is essential, as attribution models retrain continuously, causing credit shifts over time, especially as customer behavior and privacy restrictions evolve.
Table of Contents
- What is data-driven attribution and how does it work?
- What are the benefits of data-driven attribution for eCommerce?
- How much data do you need to be eligible for DDA?
- How do you switch to data-driven attribution in Google Ads and GA4?
- What are the limitations of data-driven attribution?
- How do you turn DDA outputs into better campaign performance?
- How does DDA compare with linear, time decay and position-based models?
- What common mistakes derail a DDA implementation?
- What impact does DDA have on real campaign performance?
- How can you improve the accuracy of your attribution data?
- How does machine learning shape DDA’s ongoing evolution?
- Oxedent’s take on making DDA work for eCommerce accounts
- Sources
What is data-driven attribution and how does it work?
Every last-click model asks one question: what was the final touchpoint before conversion? Data-driven attribution asks a far more useful one: which touchpoints actually moved the needle, and by how much?
The mechanism works by comparing converting paths against non-converting paths across your account. If customers who see a display ad, then click a branded search term, then convert, follow that pattern more often than customers who skip the display ad, the algorithm assigns credit to the display exposure, not just the final click. Data-driven attribution uses your account’s own conversion data to work out contribution, which is why the model behaves differently for every advertiser.
Underneath the surface, most modern implementations lean on probabilistic modelling, Markov chain analysis, or increasingly, machine learning approaches built on attention mechanisms similar to those used in language models. Industry research into transformer-based attribution, including LinkedIn’s work on sequence-aware modelling calibrated against marketing mix data, shows how these newer architectures can combine path analysis with macro-level calibration to improve both accuracy and explainability.
The inputs matter as much as the method. DDA pulls in clicks, impressions, video engagements, and cross-channel interactions wherever tracking allows. That breadth is exactly why the outputs can feel opaque: you’re not looking at a single rule, you’re looking at the output of thousands of path comparisons. When a model’s credit allocation shifts sharply, check the conversion paths report before assuming the algorithm is wrong. Sudden changes in tracking coverage explain more anomalies than the model itself.
What are the benefits of data-driven attribution for eCommerce?
The clearest benefit is visibility into channels that last-click attribution systematically undervalues. Display, YouTube, and social prospecting rarely earn the final click, so last-click reporting makes them look like they’re doing nothing, when in reality they’re doing the groundwork.
For automated bidding, this matters enormously. Smart Bidding strategies like Target ROAS lean on attribution signals to decide how much to bid on a given auction. Feed DDA-corrected data into that system, and bids adjust toward the touchpoints that genuinely drive revenue, not just the ones that happen to sit last in the path.
Practical eCommerce scenarios where this shows up:
- Display and Shopping working together: a customer browses via a Shopping ad, leaves, then returns through branded search. Last-click gives all credit to search; DDA recognises the Shopping ad’s role in creating that intent.
- Video building awareness: YouTube views that precede a purchase weeks later often get zero last-click credit but meaningful DDA credit.
- Feed quality showing its worth: better product titles and images that drive higher-quality Shopping clicks get properly rewarded rather than washed out by the final branded search click.
DDA delivers the highest marginal value in accounts with genuinely multi-channel journeys, long consideration cycles, or heavy prospecting spend, where last-click’s blind spots are widest.
How much data do you need to be eligible for DDA?
Google’s own guidance recommends accounts generate at least 200 conversions and 2,000 ad interactions within a 30-day window to keep the model performing reliably. Some conversion types, particularly lower-frequency or higher-value actions, need more: up to 300 conversions and 3,000 interactions over the same period.
Statistic callout: Google recommends a minimum of 200 conversions and 2,000 ad interactions per 30 days for reliable DDA performance, rising to 300 conversions and 3,000 interactions for certain conversion action types.
Eligibility isn’t a single account-wide switch. It’s assessed per conversion action, which means one action can qualify for DDA while another in the same account falls back to a different model entirely. Always check the DDA eligibility column in your conversion actions settings rather than assuming account-level volume guarantees action-level eligibility.
When a conversion action doesn’t meet the threshold, Google Ads falls back to a different attribution approach automatically, and you may notice fractional credit values or decimal conversion counts disappearing from reports as the system reverts to simpler logic.
To improve eligibility:
- Consolidate fragmented conversion actions so volume isn’t split unnecessarily across near-duplicate goals.
- Audit tracking setup to catch tag firing issues that quietly suppress recorded conversions, a common culprit covered in Google Ads conversion setup.
- Broaden campaign reach modestly if interaction volume is the bottleneck, rather than the conversion count itself.
How do you switch to data-driven attribution in Google Ads and GA4?
Switching is straightforward, but validating the switch properly takes more discipline than most teams apply.
- In Google Ads, go to Attribution in the navigation menu, then open the “Switch to DDA” tab. From there you can change the attribution model for individual conversion actions rather than the whole account.
- Review the auto-switch notice. Google Ads will notify admins roughly 30 days before automatically switching an eligible conversion action to DDA. You can opt out per action if you’d rather test manually first.
- In GA4, open the Advertising workspace, where cross-channel data-driven attribution is built into the reporting. GA4 exposes this at the property level through its Advertising snapshot, separate from whatever model you’re running inside Google Ads.
- Pull the model comparison report before and after the switch. This report sits inside the Attribution section of Google Ads and shows exactly how credit allocation shifts between your previous model and DDA, campaign by campaign.
- Cross-check with the conversion paths report to sanity-check that the touchpoints receiving new credit actually appear in real customer journeys, not just theoretical ones.
Pro Tip: Trial the switch on one lower-risk conversion action first, ideally something like newsletter signups rather than your primary purchase goal, and watch how sensitive your bid strategy is to the reallocated credit before rolling it out account-wide.
What are the limitations of data-driven attribution?
DDA is powerful, but it isn’t complete, and treating it as gospel is where a lot of accounts go wrong.
Consent restrictions and privacy regulation mean a meaningful share of touchpoints simply never reach the model. Platforms increasingly impute missing impressions or clicks to compensate for this gap, which can quietly inflate credit toward early-funnel touchpoints in ways that are hard to verify from the outside.
The algorithm itself is often described as a black box, and that’s a fair criticism. You can see the outputs, rarely the full logic behind a specific credit split. That’s why pairing DDA with holdout tests or marketing mix modelling gives you an independent check rather than relying on one model’s word for it.
Watch for these specific gaps:
- Offline touchpoints, like in-store visits or phone enquiries, rarely make it into the model at all.
- Word-of-mouth and organic social sharing go entirely untracked.
- Low-volume or brand-new campaigns don’t have enough path data yet for the model to draw meaningful conclusions.
- Noisy conversion definitions, where “conversion” covers wildly different customer intents, dilute what the model is actually learning from.
Avoid leaning on DDA alone when volume is thin or a campaign has only just launched.
How do you turn DDA outputs into better campaign performance?
Model outputs are only useful if they change a decision. Here’s the workflow that actually moves ROAS rather than just producing an interesting report.
- Pull the model comparison report and look specifically for keywords, campaigns, or devices where DDA credit is meaningfully higher than last-click credit. That gap is your undervalued list, using the model comparison approach Google Ads documents as the standard method.
- Run a short holdout test before reallocating budget widely. A two to six week geo or temporal holdout, sized to your volume, tells you whether the credit shift reflects genuine incremental impact or just correlation.
- Adjust automated bid targets gradually. If Target ROAS bidding has been optimising against last-click data, expect a transition period as it recalibrates to the new signal.
- Refine the creative funnel, not just the budget split. If DDA reveals video is doing real work, that’s a cue to invest in better upper-funnel creative, not simply spend more on the same assets.
- Report in blended terms. Fractional credit numbers confuse stakeholders who are used to whole conversions. Framing results through blended ROAS keeps the conversation anchored to revenue outcomes rather than abstract credit splits.
Pro Tip: Present DDA findings to stakeholders alongside a before-and-after model comparison screenshot. Seeing the actual shift in credit, rather than a verbal description of it, builds trust in the numbers far faster than any explanation.
Set a monthly cadence for reviewing model comparison data. Attribution patterns shift as campaigns mature, so a channel that looked undervalued last quarter may already be correctly priced by automated bidding this quarter.
How does DDA compare with linear, time decay and position-based models?
Last-click isn’t the only alternative to DDA, and understanding where each rule-based model falls short clarifies why algorithmic credit matters.
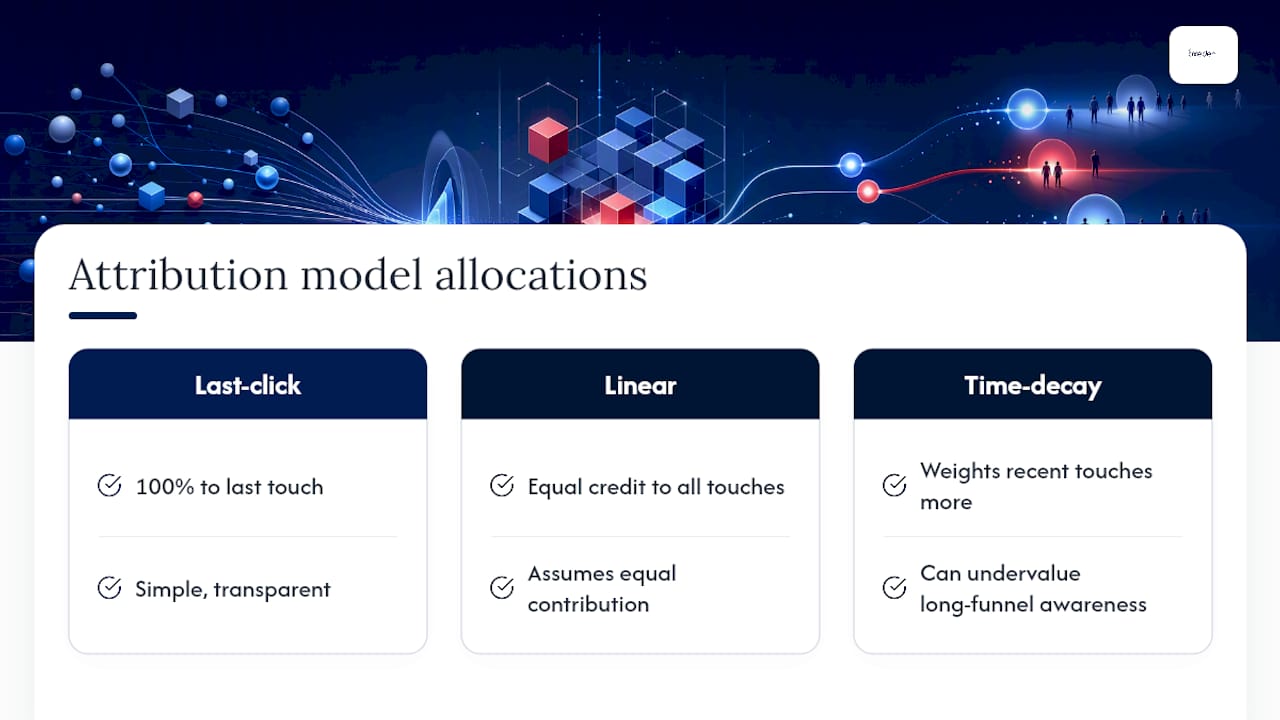
Linear attribution splits credit evenly across every touchpoint in the path. It’s simple and transparent, but it assumes every touchpoint contributed equally, which is rarely true. A brand-search click and a passive display impression are not doing the same job, yet linear treats them identically.
Time decay attribution weights credit toward touchpoints closer to conversion, giving recent interactions more influence than earlier ones. This corrects some of last-click’s bias but still uses a fixed formula rather than evidence from your actual customer paths, so it can systematically undervalue awareness-stage channels in longer sales cycles.
Position-based attribution (sometimes called U-shaped) assigns a fixed percentage, often 40%, to the first and last touchpoints, splitting the remainder across the middle. It’s a reasonable compromise for teams wanting to acknowledge both discovery and conversion moments, but the fixed percentages are still a guess, not a measurement.
Data-driven attribution replaces every one of these fixed rules with an evidence-based calculation drawn from your own conversion patterns. The trade-off is transparency: rule-based models are instantly explainable, DDA requires trust in an algorithm you can’t fully inspect. For eCommerce accounts with genuine cross-channel journeys, the accuracy gain from DDA typically outweighs the loss of that simplicity, but rule-based models remain useful as a sanity check when DDA outputs look unusual.

What common mistakes derail a DDA implementation?
The single biggest pitfall is switching models and reallocating budget in the same week. Automated bidding needs time to recalibrate to new signals, and judging performance during that adjustment window produces misleading conclusions.
Fragmented conversion tracking is a close second. Accounts running multiple overlapping conversion actions for the same event, one from a tag manager, one from a native platform pixel, split volume in ways that can push individual actions below the eligibility threshold even when total account activity is healthy.
Teams also frequently mistake attribution problems for performance problems. When a campaign’s reported conversions drop after a model switch, the instinct is to cut spend, when the real explanation is often just a reshuffling of credit rather than an actual drop in customers.
Cross-device and cross-browser tracking gaps distort DDA more than most teams expect, particularly on mobile-heavy eCommerce sites where a customer might browse on a phone and purchase on a laptop. If that identity link isn’t stitched together, the model sees two separate, incomplete paths instead of one complete journey.
Finally, treating the model comparison report as a one-time check rather than an ongoing habit means teams miss the gradual drift that happens as campaigns mature and customer behaviour shifts. What looked undervalued at launch may be fully priced in three months later, and budget decisions based on stale comparison data quietly erode ROAS without anyone noticing why.
What impact does DDA have on real campaign performance?
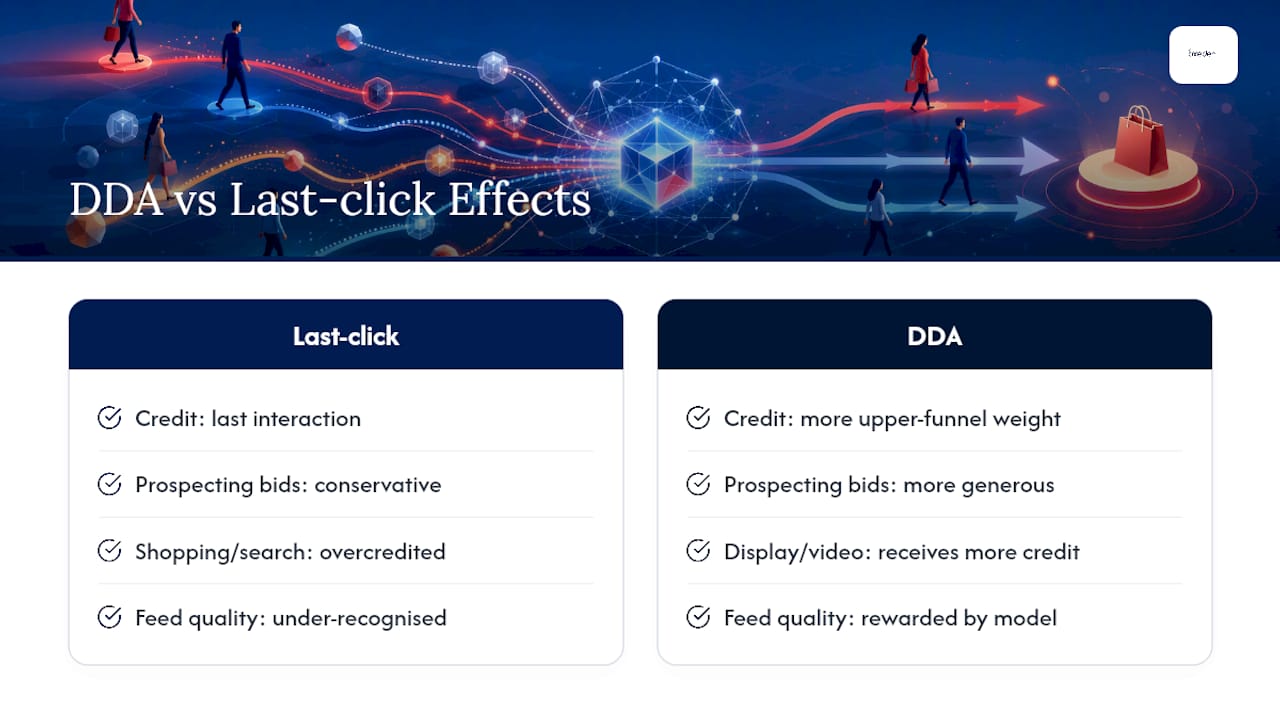
The clearest documented pattern across DDA adoption is the reweighting of credit toward upper-funnel channels that last-click had been quietly starving of budget. Accounts running Shopping alongside display or video prospecting consistently see the model comparison report reveal Shopping and search receiving less relative credit than last-click implied, with display and video picking up the difference.
That reallocation has a direct knock-on effect on automated bidding. Once Target ROAS or Maximise Conversion Value strategies ingest DDA-corrected signals, bid decisions on prospecting campaigns tend to become more generous, because the system finally sees the revenue those campaigns were quietly contributing all along.
For feed-driven eCommerce accounts specifically, the effect compounds with product feed quality. Better titles, images, and structured data drive higher-quality Shopping interactions, and DDA is more likely to recognise and reward that quality improvement than a last-click model that only credits whichever ad happened to close the sale. That’s a meaningful reason to treat feed optimisation and attribution accuracy as connected workstreams rather than separate projects.
The pattern holds outside pure digital retail too. In physical retail categories where sizing and fit drive returns, accurate measurement of what actually influences purchase decisions matters just as much as attribution model choice, because misattributed credit leads to the wrong optimisation priorities regardless of category.
How can you improve the accuracy of your attribution data?
DDA is only as good as the data you feed it, and most accuracy problems trace back to collection gaps rather than the algorithm itself.
Start with tag hygiene. Inconsistent conversion tracking, duplicate tags firing on the same event, or gaps between platform pixels and server-side tracking all corrupt the touchpoint data the model relies on. A proper audit checks that every conversion action fires once, consistently, across every browser and device your customers actually use.
Consistency across platforms matters more than most teams realise. If Google Ads and GA4 define “conversion” differently, perhaps one counts add-to-cart and the other doesn’t, you end up comparing two attribution stories that were never measuring the same thing. Align definitions before you compare model outputs across platforms.
Cross-device identity resolution deserves specific attention for eCommerce, where browse-on-mobile, buy-on-desktop behaviour is common. Signed-in user data, when available, closes gaps that anonymous cookie-based tracking simply can’t.
Finally, treat consent management as a data quality issue, not just a compliance one. The more customers decline tracking consent, the more your model relies on imputed data rather than observed behaviour, and that imputation is exactly where explainability gets harder to verify. Regularly reviewing consent rates alongside conversion volume gives you an early warning when data quality is quietly degrading.
How does machine learning shape DDA’s ongoing evolution?
DDA models aren’t static. They retrain continuously against your account’s evolving conversion data, which means the credit split you see today can shift meaningfully over months, even without you changing a single setting.
The direction of travel in the field is toward more sophisticated sequence modelling. Rather than treating a customer’s path as a simple ordered list, newer approaches borrow attention mechanisms from language modelling to weigh how touchpoints relate to each other contextually, not just by position. LinkedIn’s published research into this area demonstrates how temporal-aware embeddings and calibration against marketing mix modelling can improve both raw accuracy and the ability to explain why a model reached a given conclusion, addressing the black-box criticism directly.
Privacy-driven imputation is becoming a bigger part of that evolution too. As consent restrictions remove more raw signal, models increasingly need to infer missing touchpoints statistically rather than observe them directly, and the quality of that inference is now a genuine differentiator between attribution approaches.
For marketers, the practical implication is simple: don’t treat a DDA output from six months ago as a fixed truth. Re-run your model comparison report periodically, because the model learning from your data is, by definition, always slightly different from the one that produced last quarter’s numbers.
Oxedent’s take on making DDA work for eCommerce accounts
Attribution modelling doesn’t fix a broken account, and Oxedent treats it as a diagnostic layer sitting on top of clean fundamentals, not a substitute for them. Every audit checks conversion-action eligibility, tag hygiene, and consistency across platforms before a single model comparison report gets trusted. Skip that step, and you’re optimising against noise.
Where DDA genuinely earns its place is in feed and campaign structure decisions. When the model reveals that Shopping and prospecting display are working together rather than competing, that’s a cue to restructure campaigns around the customer journey rather than around arbitrary channel silos. That reading should be considered alongside incrementality tests and blended ROAS measurement, because a credit shift in a report needs to survive contact with a holdout test before it justifies a budget change.
The honest view: DDA is a better lens than last-click, not a perfect one. Treat its outputs as a strong hypothesis worth testing, and it earns your trust. Treat them as an automatic reallocation rule, and you’ll chase noise as often as signal.
— Biplab
Sources
Platform documentation from Google Ads and GA4 covers eligibility and setup in full. For the machine learning approaches shaping DDA’s future, see LiDDA’s research on transformer-based attribution. Oxedent’s attribution strategy guide and eCommerce PPC management service offer further practical grounding for eCommerce teams ready to act on their own data.
- About data-driven attribution – Google Ads Help
- Cross-channel data-driven attribution in Google Analytics 4 – Analytics Help
- LiDDA (LinkedIn) — transformer-based data-driven attribution (arXiv)
- Switch to DDA – Google Ads Help