


When your agency sends over a report packed with impressions, clicks, and a colourful graph that tells you nothing actionable, you are not just confused — you are losing money. Poor Google Ads reporting leads directly to budget waste, missed scaling opportunities, and decisions made on incomplete or misleading data. Agency reports must prioritise clarity, customisation, and transparency, with a sharp focus on the KPIs that actually drive your e-commerce business forward. This guide covers the standards, metrics, tools, and compliance rules you need to hold your agency accountable and extract real value from every pound you spend.
Table of Contents
- Essential standards for high-performance agency reporting
- Recommended metrics and benchmarks for e-commerce
- Reporting tools, automation, and workflow essentials
- Troubleshooting and compliance: new pitfalls in 2026
- Our take: what most agencies still get wrong with Google Ads reporting
- Grow profitably with expert Google Ads support
- Frequently asked questions
Key Takeaways
| Point | Details |
|---|---|
| Focus on transparency | Top agencies make reporting clear, tailored, and business outcome-driven for e-commerce success. |
| Track what matters | Prioritise ROAS, CPC, CTR, and conversion rate benchmarks—ignore vanity metrics. |
| Leverage automation | Automated tools and workflows save time and help you scale your optimisation efforts. |
| Always check compliance | Stay current with Google’s latest policy, reporting, and platform changes to avoid penalties and unreliable data. |
| Demand actionable insights | Ensure every report connects performance numbers to specific, revenue-driving recommendations. |
Essential standards for high-performance agency reporting
Now that we have set the scene for what is at stake, let us define what high-performance reporting should always include.
The single biggest failure in agency reporting is the absence of context. Numbers without meaning are noise. A strong report does not just tell you what happened — it tells you why it happened and what to do next. That is the difference between a report that sits in your inbox unread and one that drives your next budget decision.
Agency Google Ads reports must prioritise clarity, customisation, and transparency, with a focus on client-specific KPIs rather than generic platform statistics. Every e-commerce business has different margins, different product categories, and different growth targets. A report built for a fashion retailer looks nothing like one built for a B2B accessories brand. Customisation is not a luxury — it is a baseline expectation.
The core metrics every report must include are:
- CTR (click-through rate): The percentage of users who click your ad after seeing it. Low CTR signals weak creative or poor audience targeting.
- CPC (cost per click): What you pay each time someone clicks. High CPC in a low-margin category is a red flag.
- CPA (cost per acquisition): The total cost to generate one conversion. This must always be weighed against your product margin.
- ROAS (return on ad spend): Revenue generated for every pound spent on ads. The headline metric for most e-commerce brands.
- Conversion rate (CVR): The percentage of clicks that result in a purchase. A low CVR often points to landing page or product page issues, not ad problems.
Beyond metrics, Google requires agencies to be transparent about services, costs, and results, and to ensure client accounts comply with platform policies at all times. Violations can trigger account reviews or suspensions, which can halt your revenue overnight.
“A report that does not connect your ad spend to business outcomes is not a report — it is a receipt.”
Strong reporting also means your agency is actively managing Google Ads for e-commerce with a strategic lens, not simply pulling data and presenting it. Every report should include a clear narrative: what worked, what did not, and what changes are being made as a result. If your agency cannot answer those three questions every reporting cycle, that is a problem worth addressing immediately.
Recommended metrics and benchmarks for e-commerce
With an understanding of standards, let us dig into the metrics and benchmarks your reports should focus on.
Knowing your numbers is one thing. Knowing whether your numbers are good is another. Industry benchmarks give you a reference point, but they require careful interpretation. Context matters enormously — your sector, your average order value, your product feed quality, and your bidding strategy all influence where your metrics land.
For e-commerce, essential metrics include ROAS, conversion value, CPA, CTR, CPC, and CVR. Across all industries, average CTR sits around 6.66%, but e-commerce Shopping campaigns typically run at 3 to 4%. Average CPC across all industries is approximately £4.10 (around $5.26), while e-commerce Shopping campaigns often see CPCs as low as £0.75 to £0.92. CVR averages 7.52% across all sectors, but e-commerce typically ranges from 2 to 6% depending on category and traffic quality.


Here is a practical benchmark table to guide your expectations:
| Metric | All industries average | E-commerce typical range | Top performers |
|---|---|---|---|
| CTR | 6.66% | 3–4% | 5%+ |
| CPC | ~£4.10 | £0.75–£2.10 | Below £1.00 |
| CVR | 7.52% | 2–6% | 6%+ |
| CPA | Varies widely | £10–£60+ | Below target CPA |
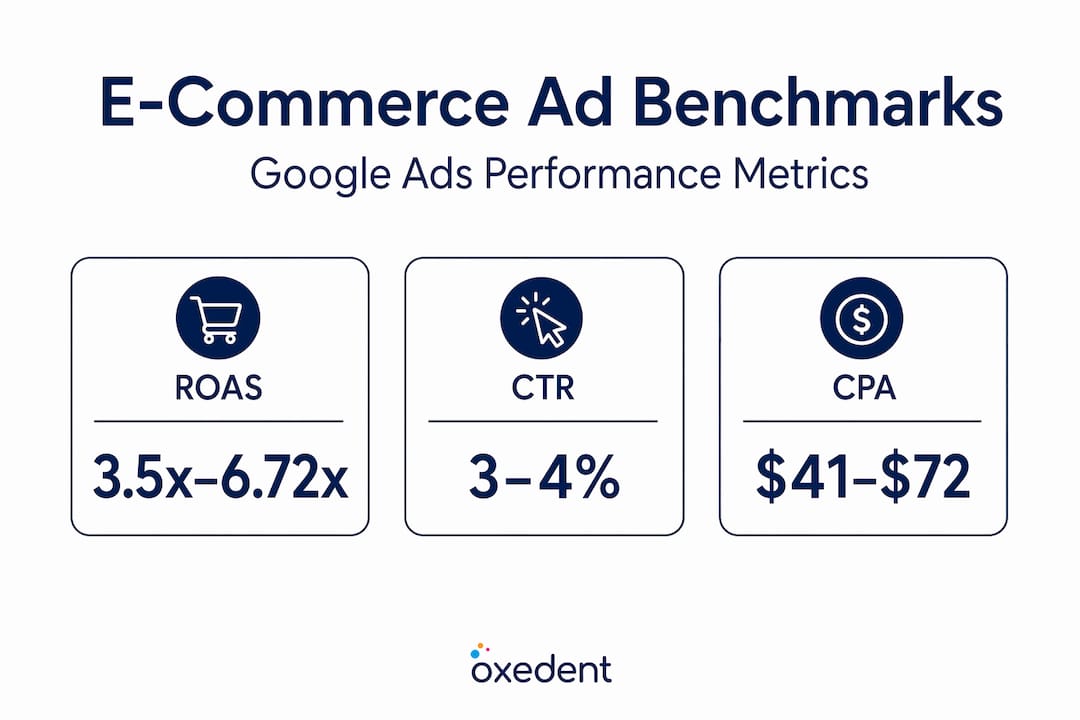
| ROAS | Varies | 3.5x–6.72x | 8x+ |
E-commerce benchmarks from multiple datasets show ROAS ranging from 3.5x to 6.72x, with top performers consistently exceeding medians through optimised product feeds and smart bidding configurations. CVR sits between 2 and 6% for most e-commerce brands, and CPC varies from £0.73 to £2.14 depending on network and campaign type.

Understanding blended ROAS is particularly important for e-commerce brands running multiple channels. Blended ROAS accounts for all revenue relative to all ad spend across channels, giving you a more honest picture of profitability than any single campaign metric.
Pro Tip: Do not obsess over industry averages. Compare your performance to your own historical data first, then to your specific product category. A 3x ROAS might be excellent for a low-margin consumable but catastrophic for a high-ticket item. Context is everything.
If your CPA is climbing, explore how to reduce cost per conversion through bid strategy adjustments, audience refinement, and feed quality improvements. If your CVR is underperforming, look at your landing page experience before blaming your campaigns. And if you want to understand how to maximise conversions without sacrificing profitability, smart bidding needs to be paired with clear conversion tracking, not just switched on and left alone.
Finally, the debate between ROAS vs POAS (profit on ad spend) is one every growing e-commerce brand should have with their agency. ROAS measures revenue. POAS measures profit. For brands with variable margins across product lines, POAS gives a far more accurate picture of whether your ads are actually making you money.
Reporting tools, automation, and workflow essentials
Once metrics and benchmarks are chosen, effective reporting comes down to methods and workflow — here is how professionals get it right.
The best metrics in the world are useless if your reporting process is inconsistent, error-prone, or so time-consuming that it crowds out actual optimisation work. This is where tools and automation make a measurable difference.
Key methodologies include automation via the Google Ads API or tools like Looker Studio for error-free data pulls, standardised templates for consistency across reporting periods, visual storytelling with charts and trend lines, and structured client consultations to align on goals and next steps. The shift from manual to automated reporting is not just about saving time — it is about accuracy and scalability.
Here is a direct comparison:
| Criteria | Manual reporting | Automated reporting |
|---|---|---|
| Accuracy | Prone to human error | Consistent and reliable |
| Speed | Hours per report | Minutes per report |
| Scalability | Difficult at volume | Scales easily |
| Customisation | Flexible but slow | Template-driven, fast |
| Cost | High labour cost | Lower ongoing cost |
Automation cuts reporting time by 60%, freeing your agency to focus on optimisation rather than admin. That time saving translates directly into better campaign management and faster response to performance changes.
A professional reporting workflow follows these steps:
- Set clear goals with your client at the start of each period — revenue targets, CPA limits, ROAS floors.
- Automate data pulls using Google Ads API connections or Looker Studio dashboards linked directly to your account.
- Apply consistent templates so every report covers the same core metrics in the same format, making period-on-period comparison easy.
- Visualise with charts to highlight trends, anomalies, and wins at a glance — not just raw numbers in a spreadsheet.
- Review with your client in a structured call or written commentary, connecting every data point to a business decision or next action.
Pro Tip: Invest in automation early, even if your account is relatively small. The time saved compounds quickly, and the reduction in human error alone justifies the setup cost. If your agency is still manually pulling data into spreadsheets each month, ask them why. A solid Google Shopping setup should be paired with equally solid reporting infrastructure from day one.
Troubleshooting and compliance: new pitfalls in 2026
Even with the right tools, 2026 brings new challenges and pitfalls — let us cover the issues and compliance rules you cannot afford to ignore.
Google has made several significant changes that directly affect the accuracy and depth of your reporting. If your agency has not addressed these with you, they should have.
Historical data retention limits now cap granular reporting data at 37 months, with aggregate data available for up to 11 years. This means any campaign-level analysis going back further than roughly three years will be incomplete. If your agency is benchmarking against older data without flagging this limitation, their analysis may be misleading.
GA4 attribution changes are another source of reporting discrepancies. Google Analytics 4 uses data-driven attribution by default, which distributes conversion credit across multiple touchpoints. This can cause your Google Ads reported conversions to look different from what GA4 shows, especially for brands with longer purchase journeys. Your agency should be triangulating data across GA4, your Google Ads account, and your CRM to give you an accurate picture.
Performance Max (PMax) campaigns add another layer of complexity. PMax does not provide granular channel-level reporting within the Google Ads interface, which makes it difficult to understand exactly where your budget is going. Agencies managing PMax without supplementary reporting from GA4 or CRM data are operating with significant blind spots.
“PMax without proper triangulation is like driving at night with no headlights — you are moving, but you cannot see where.”
Regarding attribution strategy updates, make sure your agency has reviewed how GA4’s model changes affect your specific account and adjusted their reporting methodology accordingly.
Compliance do’s and don’ts your agency must follow:
- Do ensure all ad content complies with Google’s advertising policies at all times
- Do maintain transparent documentation of all campaign changes and budget adjustments
- Do provide clients with direct access to their own Google Ads accounts
- Don’t use misleading metrics or cherry-pick data to paint an artificially positive picture
- Don’t make changes to client accounts without prior communication and approval
- Don’t ignore policy compliance requirements — violations can result in account suspension with no warning
Our take: what most agencies still get wrong with Google Ads reporting
Armed with standards and tools, let us look at why so many agencies still miss the mark — and what actually works.
Here is the uncomfortable truth: most agencies are not bad at Google Ads. They are bad at communicating Google Ads. The technical work might be solid, but if the reporting does not connect campaign performance to business outcomes, the client never truly understands the value they are receiving. That disconnect erodes trust and leads to churn, even when the campaigns are performing well.
The most common mistake we see is an obsession with vanity metrics. Impressions, reach, and click volume look impressive in a report. They feel like progress. But if those clicks are not converting into revenue, they are irrelevant. An e-commerce brand running profit-focused strategies needs to see margin-aware metrics, not platform-level statistics that serve the agency’s narrative rather than the client’s bottom line.
Generic templates are the second major failure. A template built for a lead generation business will not serve an e-commerce brand running Shopping, Performance Max, and Remarketing simultaneously. Each campaign type has different success indicators. Lumping them together obscures what is actually driving results.
What actually works is a combination of customisation, ongoing dialogue, and industry-specific context. When your agency understands your margin structure, your seasonal patterns, and your growth targets, they can build reporting that reflects your reality rather than a generic benchmark. Monthly reports should be accompanied by a conversation, not just delivered as a PDF attachment and left for you to interpret alone.
The agencies that consistently deliver strong results are the ones that treat reporting as a strategic tool, not an administrative obligation. Every report should answer three questions: what is working, what is not, and what are we doing about it? If your current agency cannot answer all three clearly, that is worth addressing directly.
Grow profitably with expert Google Ads support
If you are ready to demand more from your Google Ads reporting, here is how we can help.
Transparent, standards-driven reporting is not just good practice — it is the foundation of every profitable scaling decision you will make. When you know exactly where your budget is going, which campaigns are generating real margin, and what levers to pull next, growth becomes intentional rather than accidental.

At Oxedent, we build reporting frameworks that connect every metric to your actual business outcomes. No vanity metrics, no generic templates, no confusing dashboards. Our campaign strategy decoded approach means you always know what is happening with your budget and why. Whether you are scaling Google Ads for e-commerce for the first time or looking to improve the performance of an existing account, we offer audits, strategic consultations, and full campaign management with no long-term contracts. Get in touch today and let us show you what genuinely transparent, profit-focused reporting looks like in practice.
Frequently asked questions
What are the most important metrics to track in Google Ads reports for e-commerce?
Key metrics include ROAS, CTR, CPC, CVR, CPA, and total conversion value, with benchmarks varying significantly by channel, product category, and profit margin structure.
How often should an agency provide Google Ads reports?
Agencies should provide reports at least monthly, with weekly reporting recommended for high-spend accounts or during peak trading periods where rapid optimisation decisions are needed.
Why are my Google Ads reports missing historical campaign data?
Granular data is now limited to 37 months following Google’s 2026 update, meaning older campaign-level detail is no longer accessible, though aggregate data remains available for up to 11 years.
What compliance standards should my agency meet?
Google requires agencies to be fully transparent about services, costs, and results, and to ensure your account consistently adheres to all platform advertising policies to avoid reviews or suspensions.
How can I verify the accuracy of my Google Ads reports?
Cross-reference your agency’s report against the raw data in your Google Ads account, check figures against GA4, and ask your agency to clearly document their data sources and attribution methodology so you can validate independently.